Showing posts with label sawa. Show all posts

Saturday, August 13, 2011

Pressurized Water Reactor (PWR)


Pressurized Water Reactor (PWR)
Pressurized water reactors (PWRs) (also VVER if of Russian design) are generation II nuclear power reactors that use ordinary water under high pressure as coolant and neutron moderator. The primary coolant loop is kept under high pressure to prevent the water from boiling, hence the name. PWRs are one of the most common types of reactors and are widely used all over the world. More than 230 of them are in use to generate electric power, and several hundred more for naval propulsion. They were originally designed by the Bettis Atomic Power Laboratory as a nuclear submarine power plant.The below diagram shows the PWR and its main parts.

1.Reactor vessel 2.Fuel elements 3.Control rods 4.Control rod drive 5.Pressurizer 6.Steam generator 7.Main circulating pump 8.Fresh steam 9.Feedwater 10.High pressure turbine 11.Low pressure turbine 12.Generator 13.Exciter 14.Condenser 15.Cooling water 16.Feedwater pump 17.Feedwater pre-heater 18.Concrete shield 19.Cooling water pump

The pressurized water reactor belongs to the light water type: the moderator and coolant are both light water (H2O). It can be seen in the figure that the cooling water circulates in two loops, which are fully seperated from one another.
The primary circuit water (dark blue) is continuously kept at avery high pressure and therefore it does not boil even at the high operating temperature. (Hence the name of the type.) Constant pressure is ensured with the aid of the pressurizer (expansion tank). (If pressure falls in the primary circuit, water in the pressurizers is heated up by electric heaters, thus raising the pressure. If pressure increases, colder cooling water is injected to the pressurizer. Since the upper part is steam, pressure will drop.) The primary circuit water transferes its heat to the secondary circuit water in the small tubes of the steam generator, it cooles down and returns to the reactor vessel at a lower temperature.
Since the secondary circuit pressure is much lower than that of the primary circuit, the secondary circuit water in the steam generator starts to boil (red). The steam goes from here to the turbine, which has high and low pressure stages. When steam leaves the turbine, it becomes liquid again in the condenser, from where it is pumped back to the steam generator after pre-heating.
Normally, primary and secondary circuit waters cannot mix. In this way it can be achieved that any potentially radioactive material that gets into the primary water should stay in the primary loop and cannot get into the turbine and condenser. This is a barrier to prevent radioactive contamination from getting out.
In pressurized water reactors the fuel is usually low (3 to 4 percent) enriched uranium oxide, sometimes uranium and plutonium oxide mixture (MOX). In today's PWRs the primary pressure is usually 120 to 160 bars, while the outlet temperature of coolant is 300 to 320 °C. PWR is the most widespread reactor type in the world: they give about 64% of the total power of the presently operating nuclear power plants.
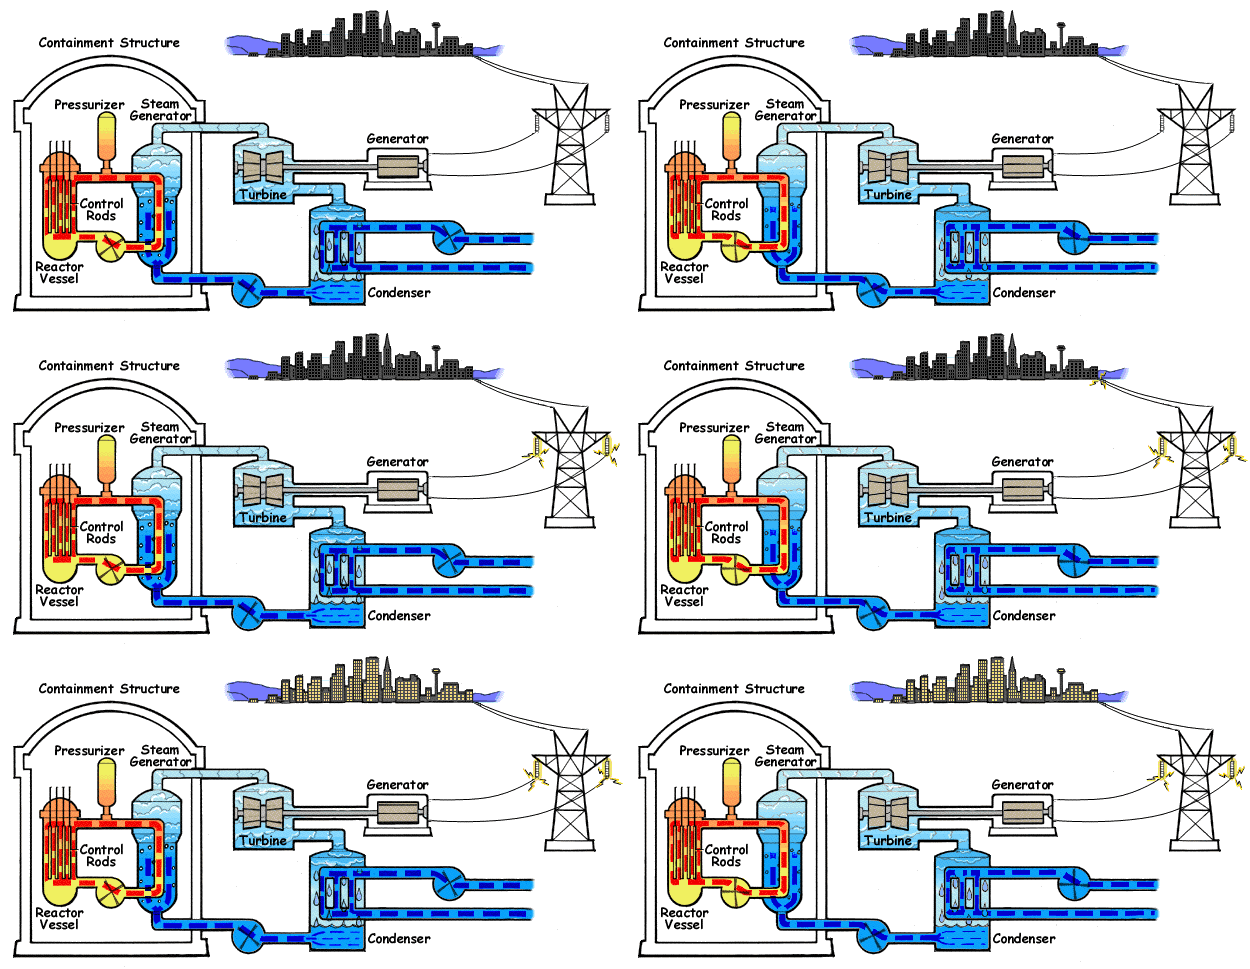
Two things are characteristic for the pressurized water reactor (PWR) when compared with other reactor types:
  • In a PWR, there are two separate coolant loops (primary and secondary), which are both filled with ordinary water (also called light water). A boiling water reactor, by contrast, has only one coolant loop, while more exotic designs such as breeder reactors use substances other than water (i.e., liquid metal as sodium) for the task.
  • The pressure in the primary coolant loop is at typically 15-16 Megapascal, notably higher than in other nuclear reactors. As an effect of this, the gas laws guarantee that only sub-cooled boiling will occur in the primary loop. By contrast, in a boiling water reactor the primary coolant is allowed to boil and it feeds the turbine directly without the use of a secondary loop.
Coolant
Ordinary water is used as primary coolant in a PWR and flows through the reactor at a temperature of roughly 315 °C (600 °F). The water remains liquid despite the high temperature due to the high pressure in the primary coolant loop (usually around 2200 psig [15 MPa, 150 atm]). The primary coolant loop is used to heat water in a secondary circuit that becomes saturated steam (in most designs 900 psia [6.2 MPa, 60 atm], 275 °C [530 °F]) for use in the steam turbine.
Moderator
Pressurized water reactors, like thermal reactor designs, require the fast fission neutrons in the reactor to be slowed down (a process called moderation) in order to sustain its chain reaction. In PWRs the coolant water is used as a moderator by letting the neutrons undergo multiple collisions with light hydrogen atoms in the water, losing speed in the process. This "moderating" of neutrons will happen more often when the water is more dense (more collisions will occur). The use of water as a moderator is an important safety feature of PWRs, as any increase in temperature causes the water to expand and become less dense; thereby reducing the extent to which neutrons are slowed down and hence reducing the reactivity in the reactor. Therefore, if reactor activity increases beyond normal, the reduced moderation of neutrons will cause the chain reaction to slow down, producing less heat. This property, known as the negative temperature coefficient of reactivity, makes PWR reactors very stable.
FuelThe uranium used in PWR fuel is usually enriched several percent in 235U. After enrichment the uranium dioxide (UO2) powder is fired in a high-temperature, sintering furnace to create hard, ceramic pellets of enriched uranium dioxide. The cylindrical pellets are then put into tubes of a corrosion-resistant zirconium metal alloy (Zircaloy) which are backfilled with helium to aid heat conduction and detect leakages. The finished fuel rods are grouped in fuel assemblies, called fuel bundles, that are then used to build the core of the reactor. As a safety measure PWR designs do not contain enough fissile uranium to sustain a prompt critical chain reaction (i.e, substained only by prompt neutron). Avoiding prompt criticality is important as a prompt critical chain reaction could very rapidly produce enough energy to damage or even melt the reactor (as is suspected to have occurred during the accident at the Chernobyl plant). A typical PWR has fuel assemblies of 200 to 300 rods each, and a large reactor would have about 150-250 such assemblies with 80-100 tonnes of uranium in all. Generally, the fuel bundles consist of fuel rods bundled 14x14 to 17x17. A PWR produces on the order of 900 to 1500 MWe. PWR fuel bundles are about 4 meters in length.Refuelings for most commercial PWRs is on an 18-24 month cycle. Approximately one third of the core is replaced each refueling.
ControlGenerally, reactor power can be viewed as following steam (turbine) demand due to the reactivity feedback of the temperature change caused by increased or decreased steam flow. Boron and control rods are used to maintain primary system temperature at the desired point. In order to decrease power, the operator throttles shut turbine inlet valves. This would result in less steam being drawn from the steam generators. This results in the primary loop increasing in temperature. The higher temperature causes the reactor to fission less and decrease in power. The operator could then add boric acid and/or insert control rods to decrease temperature to the desired point.
Reactivity adjustments to maintain 100% power as the fuel is burned up in most commercial PWR's is normally controlled by varying the concentration of boric acid dissolved in the primary reactor coolant. The boron readily absorbs neutrons and increasing or decreasing its concentration in the reactor coolant will therefore affect the neutron activity correspondingly. An entire control system involving high pressure pumps (usually called the charging and letdown system) is required to remove water from the high pressure primary loop and re-inject the water back in with differing concentrations of boric acid. The reactor control rods, inserted through the top directly into the fuel bundles, are normally only used for power changes. In contrast, BWRs have no boron in the reactor coolant and control the reactor power by adjusting the reactor coolant flow rate.Due to design and fuel enrichment differences, naval nuclear reactors do not use boric acid.
Advantages
  • PWR reactors are very stable due to their tendency to produce less power as temperatures increase, this makes the reactor easier to operate from a stability standpoint.
  • PWR reactors can be operated with a core containing less fissile material than is required for them to go prompt critical. This significantly reduces the chance that the reactor will run out of control and makes PWR designs relatively safe from criticality accidents.
  • Because PWR reactors use enriched uranium as fuel they can use ordinary water as a moderator rather than the much more expensive heavy water.
  • PWR turbine cycle loop is separate from the primary loop, so the water in the secondary loop is not contaminated by radioactive materials.
  • The reactor has high power density.
  • The reactor responds to supply more power when the load increases.
Disadvantages
  • The coolant water must be heavily pressurized to remain liquid at high temperatures. This requires high strength piping and a heavy pressure vessel and hence increases construction costs. The higher pressure can increase the consequences of a Loss of Coolant Accident.
  • Most pressurized water reactors cannot be refueled while operating. This decreases the availability of the reactor- it has to go offline for comparably long periods of time (some weeks).
  • The high temperature water coolant with boric acid dissolved in it is corrosive to carbon steel (but not stainless steel), this can result in radioactive corrosion products to circulate in the primary coolant loop. This not only limits the lifetime of the reactor, but the systems that filter out the corrosion products and adjust the boric acid concentration add significantly to the overall cost of the reactor and radiation exposure.
  • Water absorbs neutrons making it necessary to enrich the uranium fuel, which increases the costs of fuel production. If heavy water is used it is possible to operate the reactor with natural uranium, but the production of heavy water requires large amounts of energy and is hence expensive.
  • Because water acts as a neutron moderator it is not possible to build a fast neutron reactor with a PWR design. For this reason it is not possible to build a fast breeder reactor with water coolant.
  • Because the reactor produces energy more slowly at higher temperatures, a sudden cooling of the reactor coolant could increase power production until safety systems shut down the reactor.
For flash animation of PWR operation Click here

Practical types of electrical transmission line


Coaxial cable
Coaxial lines confine the electromagnetic wave to the area inside the cable, between the center conductor and the shield. The transmission of energy in the line occurs totally through the dielectric inside the cable between the conductors. Coaxial lines can therefore be bent and twisted (subject to limits) without negative effects, and they can be strapped to conductive supports without inducing unwanted currents in them.
In radio-frequency applications up to a few gigahertz, the wave propagates in the transverse electric and magnetic mode (TEM), which means that the electric and magnetic fields are both perpendicular to the direction of propagation. However, above a certain frequency called the cutoff frequency, the cable behaves as a waveguide, and propagation switches to either a transverse electric (TE) or a transverse magnetic (TM) mode or a mixture of modes. This effect enables coaxial cables to be used at microwave frequencies, although they are not as efficient as the more expensive, purpose-built waveguides.
The most common use for coaxial cables is for television and other signals with bandwidth of multiple Megahertz. In the middle 20th Century they carried long distance telephone connections

Classification of transmission lines

Classification of transmission lines
Transmission lines are classified as short, medium and long. When the length of the line is less than about 80Km the effect of shunt capacitance and conductance is neglected and the line is designated as a short transmission line. For these lines the operating voltage is less than 20KV.

For medium transmission lines the length of the line is in between80km - 240km and the operating line voltage wil be in between21KV-100KV.In this case the shunt capacitance can be assumed to be lumped at the middle of the line or half of the shunt capacitance may be considered to be lumped each end of the line.The two representations of medium length lines are termed asnominal-T and nominal- π respectively.

Lines more than 240Km long and line voltage above 100KV require calculations in terms of distributed parameters.Such lines are known as long transmission lines.This classification on the basis of length is more or less arbitrary and the real criterion is the degree of accuracy required.

Friday, August 12, 2011

Synchronous Generator


Here are the files :
  1. Paper and Q&A
Due to the size limit (in this case UI just allows not more than 2 MB), therefore the presentation file is then splited into 4 files :
  1. Page 1-20
  2. Page 21-40
  3. Page 41-60
  4. Page 61-80
  5. Page 81-91
Chairul

Power Transmission Lines as Capacitors


Last week, my mentor mentioned that high-voltage power transmission circuits could sometimes be used to provide reactive power support when on potential but off load, particularly for parallel lines.  Anecdotally, based on my limited understanding of the Ferranti Effect, this seems perfectly reasonable: light loading on the line results in elevated line charging capacitance, which is then injected to the system at the point of connection.

Ferranti Effect

In order to understand the results, we have to understand the cause behind the Ferranti Effect.
All transmission lines (even the kind discussed in Radiation and Propagation courses) behave the same way once the line length approaches a tenth of the signal wavelength.  Due to the relatively low frequency of utility power (60Hz in North America and 50Hz in many other parts of the world), the wavelength is pretty long, so these effects only begin to appear in significantly long (greater than 300km) transmission lines.
The classical model is:

Source: Wikipedia
Lines of a moderate length (greater than 300km) can be modelled simply as a series resistance, series inductance and shunt capacitance – in Power Systems, we often call this model a “Pi section” (this moniker makes more sense if you separate the capacitance at the sending and receiving ends of the line, dividing them by two).  Longer lines (those exceeding 500km) are then an extension of an already-solved problem: they can simply be modelled using multiple moderate-length segments as appropriate.
Keen readers will notice that this is, quite simply, a two-port network model: we can consider each Pi section a black box, with sending-end voltage/current and receiving-end voltage/current.  Many of us rely on an approximation of how wires behave: in most applications, they have infinitesimal impedance, and so the impedance may be neglected in calculations.  However, when we approach power transmission, the voltages and currents are much higher than experienced elsewhere, which can have quite a profound impact on system operation.
I hope that this brief discussion provided a reasonable introduction or review.  If not, the Kathmandu University also has a very good handout on the subject.

Surge Impedance Loading

Based on the telegrapher’s equations and the above model, we can determine the characteristic impedance (also called surge impedance) of the transmission line as:
In all transmission lines, for power or signals alike, optimal power transfer occurs when the load impedance matches the characteristic impedance.  In Power Systems, we like to relate these quantities to units Power (Real, Reactive and Apparent) because these quantities can always be directly compared regardless of phase angles, power factors, harmonic distortion levels or voltage levels.
The Surge Impedance Loading converts the characteristic impedance (ohms) into a power (Watts) value:
If the amount of power being transmitted equals the SIL, the line mutual coupling (the inductance and capacitance in the model) cancels each other out, thus resulting in the line operating at unity power factor.  When the amount of power transferred is below the SIL, the power factor is leading (capacitive), and when the amount of power transferred is above the SIL, the power factor is lagging (inductive).

An intuitive model

Intuitively, I understand this behaviour by thinking about the cause of these impedances, though I am not a physicist, so this intuition is best understood as a useful analogy, not as fact.  I imagine lines have some slight twist when installed, giving rise to the series inductance.  Likewise, lines are conductors of different potential separated by a dielectric (air), which results in some capacitive coupling between lines.
Recall that power loss due to the resistance of a power line can be calculated using Joule’s law:
Similarly, the reactive power absorbed by (or injected from, if Q is negative) a power line into the system can be calculated using (where X is defined as negative for capacitors and positive for inductors):
The inductance is fixed, but the amount of reactive power absorbed by the series inductance is proportional to the current flowing across the line.  On a lightly loaded line, or where the receiving end is an open circuit, the current is very small, so the inductive nature of the line is minimized and the capacitive behaviour dominates.  Thus, the line is below the SIL and operates with a leading (capacitive) power factor.

Power transmission lines as capacitors

Finally, to get to the real point of this article. Given the above background, it follows that lightly loaded or open-ended lines will inject reactive power. With lightly loaded parallel redundant lines, it is therefore possible to open one line and use it to provide reactive power (var) support for the system.
For my simulation, I used two parallel 230kV lines, each 600km long, with three ideally-transposed phases on each right-of-way (in delta configuration with four bundled sub-conductors). These lines were supplied by an infinite bus (voltage source at 22kVrms line-to-line) with a 22/230kV Wye-Delta transformer. At the receiving end, a 300MW+5Mvar load was installed.
Here are the two circuits in steady state (note that BRK2 is open):
Dual 230kV Circuits, One Line Open

Note that TLine1 has a depressed receiving end voltage due to the current flowing a cross that line (the line inductance cancels out the Ferranti effect), butTLine2 has an elevated receiving end voltage due to the Ferranti Effect. Also note that the reactive power flow at the sending end for TLine2 is negative, indicating that reactive power is flowing “backwards” to the sending end.
Let’s take a closer look at what’s happening at the receiving end:
Mvar flow at receiving end of 230kV circuits

The breakers were configured to begin open and close in at 250ms to energize the circuit. Afterward, BRK1 remained closed and BRK2 was reopened at 500ms. We can see that reactive power initially flows across both lines, but when the receiving end circuit breaker is opened, reactive power ceases to flow. Note that the x-axis shows elapsed time of the simulation (in seconds).
The sending end, by contrast, is much more interesting:
Mvar flow at sending end of 230kV circuits

When both breakers are opened (until 250ms), there is a significant line charging capacitance drawing reactive power from the system. After the breakers close, the reactive power demand drops significantly (though it is still slightly capacitive due to both lines being lightly loaded). Once TLine2 is opened at the receiving end at 500ms, something interesting happens: the reactive power injected by that line into the system returns to its line-end-open state, while TLine1 increases its reactive power consumption in unison.
In conclusion, it is entirely possible to use a transmission line as a shunt capacitor

Biomass

Traditionally, biomass has been used in four ways:
 1. For industrial purposes (shelter, building materials, furniture, utensils, etc)
 2. Burning (for domestic energy use such as heating, lighting and cooking, and for land clearance) 
 3. Conservation (left on land or added to soil as compost, to enrich soil and biodiversity, avoid erosion, etc.) 
 4. For food (including livestock feed, while using fertilizers and with waste dumped in landfills or sea)

In the light of rising costs of fossil fuel and climate change concerns, other uses are considered, specifically: 
 5. Low-footprint food (reduced meat and reduced use of chemical fertilizers, with waste processed)
 6. Commercial combustion in power plants, furnaces, kilns, ovens and internal combustion engines
 7. Burial 
 8. BECCS (Bio-Energy with Carbon Capture & Storage)
 9. Biochar (Pyrolysis resulting in biochar, syngas and bio-oils)
10. Biochar + BECCS (Biochar + Bio-Energy with Carbon Capture & Storage)

Table 1. Comparison of methods to process biomass (Energy and Carbon)
 Combustion Burial BECCS Biochar Biochar + BECCS
 Energy - year 0  1.0 -0.1 0.8 0.5 0.5
 Carbon - year 0 -0.1  1.0 0.8 0.5 0.9
 Energy - out years 0.4 0.4
 Carbon - out years 0.5 0.5
 Total  0.9  0.9 1.6 1.9 2.3
Above table by Ron Larsen, from this message, shows five methods to process biomass, rated (with 1.0 being the highest score) for their ability to supply energy and for their ability to remove carbon from the atmosphere.  

Above table shows that each way to process biomass waste has advantages and disadvantages:
 6. Combustion may seem attractive for its supply of energy, while having negative impact due to emissions 
 7. Burial can minimize emissions, but it doesn't provide energy, in fact it costs energy
 8. BECCS can score high on immediate energy supply as well as on avoiding carbon emissions
 9. Biochar scores well regarding immediate energy supply and emissions, with additional future benefits
10. Biochar + BECCS has all the benefits of biochar, while also capturing and storing pyrolysis emissions

The table below also incorporates above-mentioned traditional use of biomass, while using a wider footprint, i.e. with scores not only reflecting the ability of the method to remove carbon from the atmosphere, but also looking at emissions other than carbon.
Table 2. Comparison of ten uses of biomass (Energy and Footprint)
Energy - year 0Footprint - year 0Energy - out yearsFootprint - out yearsTotal
Industrial -0.1 0.1 0.0
Burning 1.0-1.0
   0.0
Conservation  -0.2
  -0.2
Food  -0.3 -0.3
Low-footprint food  
 0.0
Combustion 1.0-0.1
 0.9
Burial-0.1 1.0  0.9
BECCS 0.8  0.8 
 1.6
Biochar 0.5  0.50.4   0.5 1.9
Biochar +BECCS 0.5  0.9 0.4   0.5 2.3

Biochar gets its positive "out years" scores for increasing vegetation growth over time, as it improves soil's water and nutrients retention, while also reducing the need for chemical fertilizers. 

These qualities of biochar are also helpful in efforts to bring vegetation into the desert by means of desalinated water, as proposed by a number of scientists. A study by Leonard Ornstein, a cell biologist at the Mount Sinai School of Medicine, and climate modelers David Rind and Igor Aleinov of NASA's Goddard Institute for Space Studies, all based in New York City, concludes that it's worth while to do so.
They envision building desalination plants to pump seawater from oceans to inland desert areas using pumps, pipes, canals and aqueducts. The idea is that this would result in vegetation, with the tree cover also bringing more rain -- about 700 to 1200 millimeters per year -- and clouds, which would also help reflect sunlight back into space.
This would not only make these deserts more livable and productive, it would also cool areas, in some cases by up to 8°C .
Importantly, vegetation in the deserts could draw some 8 billion tons of carbon a year from the atmosphere -- nearly as much as people now emit by burning fossil fuels and forests. As forests matured, they could continue taking up this much carbon for decades.
The researchers estimate that building, running, and maintaining reverse-osmosis plants for desalination and the irrigation equipment will cost some $2 trillion per year.

The way back to 280 ppm

Concentration of carbon dioxide in the atmosphere reached 394.97ppm at Mauna Loa in May — 41% above the 280ppm it had been for thousands of years before the Industrial Revolution started.

Given the dangers of global warming, carbon dioxide needs to get back to 280ppm. Emission cuts alone will not be able to accomplish this, so what more can be done?

Large drops in carbon dioxide have taken place in history, and are attributed to weathering, i.e. rocks breaking down and carbonates being deposited on ocean floors. However, it takes nature many, many years to do this. To make this happen at accelerated rates, carbon dioxide removal methods can be deployed that are typically referred to as mineral carbonation and accelerated weathering.

emissions cut 80% by 2020At first glance, one may suggest implementation of policies such as cap-and-trade or cap and capture to make those who put carbon into the atmosphere pay for its removal. More effective, though, is a combination of two types of feebates, working separately, yet complimentary, to get emissions cut 80% by 2020 and carbon dioxide on the way back to 280ppm.

Many carbon dioxide removal methods are energy-intensive. As long as the energy used is expensive and polluting, not much can be achieved. A rapid shift to clean energy is necessary, which is best facilitated through energy feebates.

As the number of solar and wind facilities grows, large amounts of clean electricity will become available at off-peak hours, when there's little demand for electricity. This will make such electricity cheap, bringing down the cost of methods such as accelerated weathering, which can take place at off-peak hours. Such energy will also make carbon dioxide removal more effective, since the energy is clean to start with.


Energy feebates can best clean up energy, while other feebates can best raise revenue for carbon dioxide removal. Energy feebates can phase themselves out, completing the necessary shift to clean energy within a decade. Carbon dioxide removal will need to continue for much longer, so funding will need to be raised from other sources, such as sales of livestock products, nitrogen fertilizers and cement.

FeebatesA range of methods to remove carbon dioxide would be eligible for funding. To be eligible for rebates, methods merely need to be safe and remove carbon dioxide. Methods could remove carbon dioxide from the atmosphere and/or from the oceans.

Rebates favor methods that also have commercial viability. In case of accelerated weathering, this will favor production of building materials, road pavement, etc. Such methods could include water desalination and pumping of water into deserts, in efforts to achieve more vegetation growth. Selling a forest where once was a desert could similarly attract rebates.

Some methods will be immediately viable, such as afforestation and biochar burial. It may take some time for methods such as accelerated weathering to become economically viable, but when they do, they can take over where afforestation has exhausted its potential to get carbon dioxide back to 280ppm.